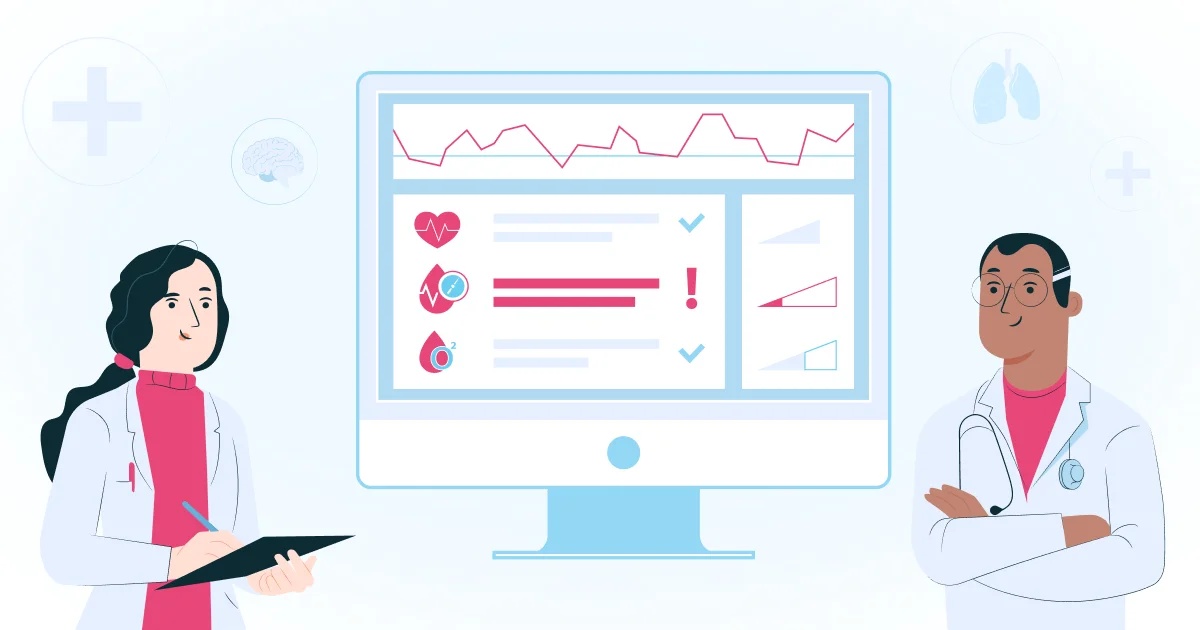
Healthcare Data Visualization: Analytics for Better Patient Care

Want to know more? — Subscribe
Data is the fundamental basis for patient care, medical research, and healthcare management. Yet, its real power emerges when data is effectively interpreted…
Data is the fundamental basis for patient care, medical research, and healthcare management. Yet, its real power emerges when data is effectively interpreted and presented. This is when healthcare data visualization transforms complex information into practical insights.
In this article, Softermii explores the multifaceted world of this practice. We'll discuss why visualization matters, discover various data sources and types, and examine the most popular tools in the market. We will highlight the expertise of Softermii in developing My Health Explained, bespoke diabetes treatment software with data visualization solutions.
Want a skimmable version?
Get a quick overview of our article with AI to access all the important information quickly.
Generate AI SummaryHide summary
Want a skimmable version?
Get a quick overview of our article with AI to access all the important information quickly.
Generate AI SummaryHide summaryHow healthcare data visualization turns complex data into better patient care — why it matters and the main data sources behind it.
Why Visualization Matters in Healthcare Data
Data visualization transforms vast data sets into understandable, actionable insights. Here are some ways it affects patient care, predictive analytics, and decision-making speed.
Augmenting Patient Care
Data visualization offers healthcare providers a clear, immediate understanding of patient data. Visual tools help to interpret patient histories, treatment progress, and health patterns. For example, heatmaps and trend lines enable quick identification of concerning changes. This clarity supports personalized care plans as doctors can make informed decisions based on individual needs.

Pattern Recognition and Predictive Analytics
In health data visualization, complex algorithms are often combined with visual analytics. Integrating machine learning algorithms with visual data interpretation aims to forecast future events. They can identify trends and anomalies that might be invisible in raw, numerical formats. This ability is crucial for:
- predicting disease outbreaks;
- identifying risk factors for chronic diseases;
- anticipating individual patient crises before they occur.
Targeted Data Presentations
Data visualization allows for targeted presentations of information tailored to the needs of various stakeholders:
- For clinicians, visualization can highlight critical patient information required for immediate decision-making.
- For administrators, it can showcase performance metrics or resource utilization.
- For patients, simplified visualizations enhance understanding of their health conditions and treatment plans.
This customization ensures that each group receives the most useful and relevant data.
Accelerated Decision-Making
In the fast-paced healthcare environment, the speed of decision-making can be critical. Data visualizations synthesize complex information into digestible formats, enabling quicker understanding and analysis. This rapid comprehension leads to faster, yet still informed, decision-making in critical situations. For instance, dashboards in the ER can display real-time data so providers can make quick, life-saving decisions.
Fraud Detection and Transparency
Data visualization can map financial transactions, patient billing, and insurance claims. This way, irregularities and potential fraudulent activities become more apparent. This transparency is also essential for building trust within the healthcare system. It ensures compliance and maintains the integrity of healthcare practices.

Project Calculator
Get the detailed project estatimation – choose the details of your product and calculate the quote of the development
Calculate nowData Sources in Healthcare
The sources of data determine the quality and applicability of the insights derived. Each tool presents its unique contributions and challenges. Understanding them is crucial for grasping the full extent of visualization capabilities.
Electronic Health Records (EHRs)
Electronic Health Records encompass a wide range of patient information, including:
- medical histories;
- treatment records;
- diagnostic information;
- demographic details.
EHRs give a complete view of a patient's health, serving as a vital data source for long-term studies and managing population health. The structured nature of EHR data, coupled with FHIR standard, makes it particularly conducive to visualization. It enables providers to track patient progress, identify trends, and make data-driven decisions.
However, challenges arise in the standardization and interoperability of EMR systems. Different providers often use different systems, causing variations in how data is recorded and stored. For an effective process, it's essential to have standardized data as it can be easily gathered and analyzed. Overcoming these barriers leads to improved patient outcomes and more efficient healthcare delivery.
Wearables and IoT Devices
Wearables and Internet of Things devices can track a variety of health metrics:
- physical activity;
- sleep patterns;
- heart rate;
- glucose levels, etc.
This continuous data stream is invaluable for preventive care and chronic disease management. Real-time, patient-generated data often offers insights that traditional medical data cannot. It also opens avenues for personalized healthcare and patient empowerment.

Due to its diversity and volume, handling and analyzing data from wearables and IoT devices can be challenging. Ensuring the accuracy, privacy, and security of this data is paramount.
Combining this data with regular healthcare records to form a complete patient profile requires advanced tools for processing and visualization. Addressing these challenges is essential to enhance patient monitoring, lifestyle interventions, and health outcome prediction.
Laboratory and Imaging Data
Blood tests, genetic testing, and pathology reports offer detailed insights into a patient's health at a molecular level. Imaging data, from X-rays to MRIs, visually explains a patient's anatomical and functional status.
These data types are indispensable for accurate diagnosis and treatment planning. Visualizing this data can aid in early disease detection and treatment efficacy assessment.

The complexity of laboratory and imaging data presents unique challenges in visualization. It requires sophisticated tools to represent and interpret the data accurately. Integrating data with other healthcare sources enhances its utility and makes its management more complex.
The challenge is to create visualizations that are detailed enough for clinical use yet intuitive for quick interpretation. Such balance is vital in the fast-paced environment of healthcare decision-making.
Types of Healthcare Data Visualization
Clinical data visualization encompasses various types of graphical representations. These visual tools are integral in transforming raw data into insightful visuals. Each has unique strengths, making them suitable for advanced data analytics and decision-making.
Dashboards
Dashboards are one of the most prevalent forms of data visualization in healthcare. They provide a consolidated view of key metrics, enabling quick access to critical information. Its customization allows hospitals to display a wide range of data, from patient statistics to operational efficiency metrics. For instance, a central dashboard may show real-time occupancy rates, staff allocation, and patient flow.

The dashboard's effectiveness depends on its design and the quality of the underlying data. Overloading a dashboard with too much information can lead to confusion. Meanwhile, poorly designed panels may fail to highlight important trends or anomalies.
An effective dashboard is intuitive, focuses on KPIs, and avoids information overload. It balances detail and overview so users can quickly grasp the current state and delve deeper into the data if needed.
Heat Maps
Heat maps are particularly useful for identifying patterns and variations in complex datasets. In healthcare, they help to visualize:
- the geographical distribution of diseases;
- hospital readmission rates;
- body temperature variations in clinical imaging;
- patient outcomes across different demographics.
Using color gradients in heat maps makes it easy to identify high-density areas or critical points that require attention. Thus, the simplicity of heat maps makes them an effective tool for showing complex data to a broad audience.
The strength of heat maps lies in their ability to reveal trends and outliers at a glance. For example, a heat map can quickly show areas with higher rates of a specific illness, guiding public health interventions.
The choice of color scale and data granularity make heat maps effective. They must be intuitive for the target audience, including users with color vision deficiencies.
Time-series Charts
These charts help track patient progress, the effectiveness of treatments, or the spread of diseases over time. Time-series charts provide a clear picture of progression, patterns, or irregularities by visualizing data points chronologically.

Thus, they can be instrumental in predictive modeling, helping to anticipate future trends based on past data.
The challenge with time-series charts is in handling large datasets and presenting them in an easy way to interpret. It's important to ensure the time scale is appropriate and the data is not too congested to create effective time-series visuals.
Real-time Monitoring
A significant application of time-series charts in healthcare is real-time monitoring. It involves tracking patient data, such as vital signs or medication adherence, in real time. This monitoring is vital in critical environments where swift decision-making can be life-saving. Thus, providers can detect subtle changes in patient conditions and respond to emerging health issues.
Cutting-edge Tools for Healthcare Data Visualization
New health data visualizationservices continue to reshape data analysis and presentation. This section explores advanced visualization tools in healthcare, comparing custom and off-the-shelf programs. Additionally, we explore top market offerings, their unique features, and suitability, emphasizing the importance of the modernization of data architecture.
Custom Solutions vs Off-the-shelf Software
Custom data visualization solutions can meet the specific needs of a healthcare organization. Hospitals can integrate them with existing systems to handle unique data types or visualization needs. Organizations have complete control over the functionality and design of their tools. This approach ensures the perfect alignment with workflows and data analysis requirements.
$167.0 billion by 2030
The healthcare analytics market is expected to achieve a value of $167.0 billion by 2030, experiencing a CAGR of 21.4% throughout the forecast period from 2023 to 2030
At the same time, custom solutions can be resource-intensive. They may require significant time and investment in software development and maintenance. Also, the level of technical expertise they demand may not be readily available in all organizations.
Off-the-shelf software, meanwhile, provides an immediate, cost-effective solution. These often user-friendly solutions come with a range of pre-built templates and features. They receive regular updates and support from the official vendor. Off-the-shelf tools can cater to a broad range of visualization needs and are easier to implement than custom solutions.
The drawback of off-the-shelf software lies in its limitations in customization. These solutions may not align with every organization's specific needs. Also, integrating them with existing systems can sometimes be a challenge.
Top Market Offerings
Certain tools stand out in visualization for their exceptional capabilities and widespread adoption. Tableau, Domo, and Bold BI are among the top market offerings. Their distinct features and ease of use make them essential tools in modern healthcare data management.
Tableau
Tableau is known for its powerful and user-friendly interface with analytics features. It offers extensive capabilities for creating a wide variety of visualizations and dashboards. Tableau can handle EHRs' large datasets and present them in a digestible format. Thus, Tableau is a top choice for organizations seeking deep insights from their data.

Domo
Domo stands out for its business intelligence tools and real-time data visualization capabilities. It's particularly beneficial for healthcare organizations that require accessibility across multiple locations. The program can collate data from disparate sources, providing holistic insights into operational and clinical data. Its collaborative features also facilitate cross-departmental data sharing and decision-making.

Bold BI
Bold BI is gaining traction for its intuitive dashboard creation and robust data integration features. It offers extensive customization options so institutions can tailor it to their needs. Bold BI's collaborative elements also assist in sharing and reporting data insights within the organization.

Softermii Experience
Softermii has been helping different institutions develop diverse healthcare software for over nine years. Our deep understanding of care regulations enables us to create innovative and compliant industry standards products. Professionals can gain actionable insights much easier with software that can handle large datasets.
Our team closely collaborates with healthcare organizations to understand their specific needs. This way, the final visualization tool enhances data comprehension, decision-making, and patient outcomes.
My Health Explained
My Health Explained is an excellent example of how patient data can be visualized to benefit users. This platform offers individual programs to treat diabetes. By offering advanced tools, My Health Explained enables users to gain a clear familiarity with their diabetes. The software must be accessible and easy for healthcare professionals and patients.

My Health Explained platform collects health metrics and patient information, applying stringent measures to protect privacy and confidentiality. This data is then transformed into intuitive formats so patients can understand their health status and the impact of different treatments or lifestyle choices. Using data visualization in this context also helps providers deliver personalized care.
Conclusion
Data visualization in healthcare can enhance patient care and streamline multiple operations. Integrating dashboards, heat maps, and time-series charts is driving a new era of data-driven care. Advanced visualization software provides tailored solutions to meet the diverse needs of institutions.
Data visualization enables providers to gain insights, improve patient outcomes, and make data-driven decisions. As healthcare data continues to grow, institutions should adopt user-friendly visualization platforms. Implementing the right tools and techniques allows providers to visualize data in an actionable way.
Stakeholders should prioritize effective data visualization in the healthcare industry. With the expertise of the Softermii team, organizations can translate complex data into compelling visual narratives. So, are you ready to enhance patient care, reduce costs, and enhance health outcomes? Contact us, and we'll help you streamline your operations and contribute to the improvement of care delivery.
Enhance patient care and streamline multiple operations by implementing data visualization in your healthcare solution
Frequently Asked Questions
What is healthcare data visualization?
Clinical data visualization is the practice of transforming healthcare data into visual formats. For example, charts, graphs, dashboards, and maps. This process helps in making complex data sets understandable and actionable. It aids healthcare professionals in identifying trends, patterns, and anomalies. Visualization also facilitates better patient care and informed decision-making.
What types of healthcare data can be visualized?
Healthcare data visualization can encompass a wide array of data types, including:
Any quantifiable data can be visualized to enhance understanding and aid in decision-making.
How can healthcare data visualization benefit patients?
Health data visualization can enhance the clarity and understanding of health information. Visual tools help explain diagnoses, treatment plans, and health trends more engagingly. This understanding can lead to better patient engagement, adherence to treatment plans, and more informed health decisions. Real-time monitoring through visual tools can lead to timely interventions, improving patient outcomes.
What is the best data visualization for healthcare?
The "best" data visualization tool depends on the specific needs and context:
The choice of tool should align with the data's nature, the intended audience, and the specific insights being sought.
What are the advantages of data visualization in healthcare?
Data visualization for healthcare offers numerous advantages:
How about to rate this article?
0 ratings • Avg 0 / 5 · Thanks for rating!
Written by:

Co-Founder
Andrii Horiachko is a Co-Founder of Softermii with over 12 years of experience in software development, eight of them spent building and managing Softermii itself. He is responsible for technology-innovation in clients’ projects, making sure every product runs on a modern, carefully chosen tech stack that can sustai…


