How to Measure ROI from AI Projects: KPIs, Frameworks & Templates

Want to know more? — Subscribe
ROI from AI projects measures whether the value you gained exceeds what you invested. It compares the financial returns and business benefits generated by an…
ROI from AI projects measures whether the value you gained exceeds what you invested. It compares the financial returns and business benefits generated by an AI initiative against its total costs. 96% of organizations investing in AI report productivity gains, with 57% describing those gains as significant, but translating productivity into measurable financial returns requires a systematic approach.
Key takeaways
- 96% of organizations investing in AI report productivity gains, with 57% describing those gains as significant.
- AI ROI equals (Total AI-Driven Value minus Total AI Investment) divided by Total AI Investment, multiplied by 100.
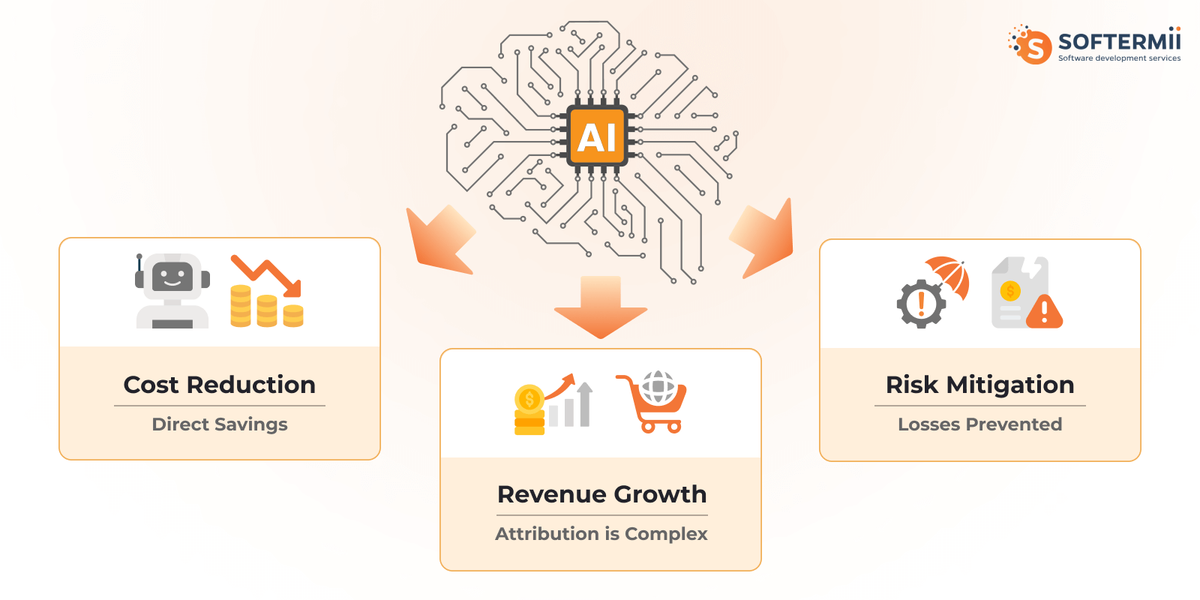
- AI creates value across three dimensions: cost reduction, revenue generation, and risk mitigation, each behaving differently.
- Unlike traditional software, AI delivers value gradually, with returns compounding as models train on real data and usage scales.
- Only 6% of organizations qualify as AI high performers reporting 5% or more EBIT impact, per McKinsey's 2025 research.
Unlike traditional software ROI, AI delivers value gradually; some benefits appear in weeks, others take months to materialize, and the impact often grows over time as models improve and usage scales. AI adoption reached 54.6% among U.S. workers in 2025—faster than personal computers or the internet at comparable stages, yet many organizations struggle to capture measurable returns from their investments.
Want a skimmable version?
Get a quick overview of our article with AI to access all the important information quickly.
Generate AI SummaryHide summary
Want a skimmable version?
Get a quick overview of our article with AI to access all the important information quickly.
Generate AI SummaryHide summaryHow to measure ROI from AI projects — why traditional ROI models fall short, the core formula, and what counts as value.
What ROI Means in AI Projects (And Why Traditional ROI Models Fall Short)
Traditional ROI calculations work well for predictable investments. You buy equipment, it produces widgets, and you measure output. AI doesn't work that way. According to McKinsey's 2025 AI research, only 6% of organizations qualify as AI high performers, reporting significant value with 5% or more EBIT impact—illustrating how few companies successfully navigate AI's unique ROI characteristics.
AI projects create value across three different dimensions, and each one behaves differently:
Cost-reduction AI cuts expenses by automating tasks or improving efficiency. A customer service chatbot that handles 60% of inquiries saves labor costs. The ROI here is straightforward—you spend less on salaries or operations.
Revenue-generation AI increases income by improving conversions, recommendations, or pricing. An e-commerce algorithm that lifts average order value by 8% directly adds to the bottom line. The challenge is isolating AI's contribution from other factors, such as marketing or seasonality.
Risk-mitigation AI prevents losses or compliance failures. Fraud detection systems don't generate revenue—they stop money from disappearing. The value is in what didn't happen, which makes ROI harder to measure but no less real.
Gartner research suggests that traditional ROI metrics may not fully capture the value of generative AI, recommending that organizations also consider "Return on Employee" and "Return on Future" alongside financial returns.
The bigger issue is timing. Traditional software delivers value almost immediately after deployment. AI projects typically follow a different curve: minimal returns during the pilot phase, growing benefits as the model trains on real data, and compounding value as the system improves and scales. A model that saves $50,000 in month three might save $200,000 in month twelve as it handles more volume and makes better decisions.
ROI in AI projects is the measurable business value created by an artificial intelligence system compared to the total cost of building, deploying, and maintaining it—calculated over a realistic timeframe that accounts for gradual value realization.
The Core Formula for Measuring ROI from AI Projects
The classic ROI formula is:
ROI = (Value Gained - Cost of Investment) / Cost of Investment × 100
For AI projects, this becomes:
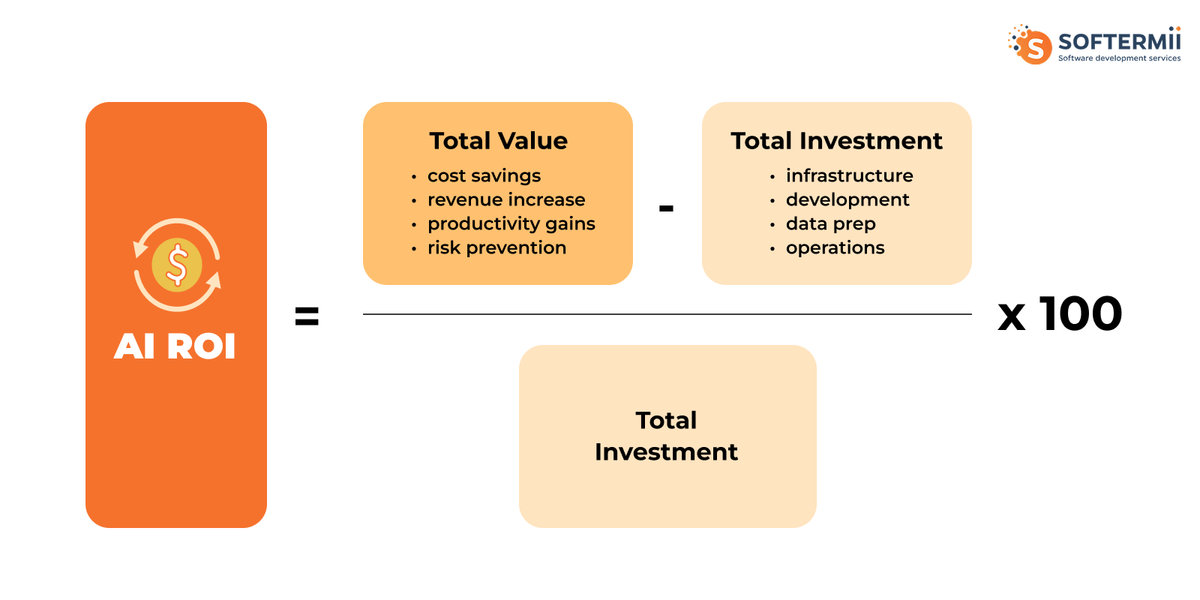
AI ROI = (Total AI-Driven Value - Total AI Investment) / Total AI Investment × 100
Breaking Down Each Variable
Total AI-Driven Value includes:
- Direct cost savings from automation or efficiency gains
- Revenue increases attributable to AI recommendations or predictions
- Cost avoidance from prevented errors, fraud, or compliance violations
- Productivity gains are measured in time saved or output increased
- Quality improvements that reduce rework or customer churn
Total AI Investment includes:
- Data infrastructure and preparation costs
- Model development and training expenses
- Cloud computing and storage fees
- Integration with existing systems
- Ongoing maintenance, monitoring, and retraining
- Team salaries allocated to the AI project
- Licensing fees for AI tools or platforms
Simple Numeric Example
A logistics company builds an AI system for route optimization:
- Total Investment: 500,000 (infrastructure, development, 6 months of operation)
- Value Generated: Fuel savings of 400,000 + reduced overtime costs of 250,000 = 650,000
- AI ROI = (650,000 - 500,000) / 500,000 × 100 = 30% ROI
This means that for every unit invested, the company recovered 1.30 units—a 30% return over the measurement period.
Want to calculate your specific AI project ROI? Try Our Interactive ROI Calculator
What Counts as "Value" in AI Projects
Measuring AI value means looking beyond simple cost savings. The returns fall into four distinct categories, and missing any of them underestimates what your AI project actually delivers.
Direct Financial Value
This is money you can see moving on your balance sheet. Direct financial value includes measurable cost reductions and revenue increases that trace directly back to the AI system.
Cost reduction examples:
- A manufacturing AI that cuts defect rates, saves material costs, and reduces waste disposal fees
- An HR chatbot that handles 10,000 employee questions monthly eliminates the need for two support staff members
- Automated document processing that replaces manual data entry reduces labor expenses
Revenue increase examples:
- Recommendation engines that increase average order value
- Dynamic pricing algorithms that optimize margins without losing customers
- Lead scoring models that help sales teams close deals faster
The key test: can you point to a specific line item that changed after AI deployment?
Indirect iFnancial Value
Indirect value affects your finances but requires an extra step of calculation. The AI improves something that eventually impacts costs or revenue.
Productivity gains are the most common indirect value. If your analysts spend 15 hours per week preparing reports and AI reduces that to 3 hours, you haven't cut costs directly—but those 12 hours can now go toward higher-value work like strategy or client relationships.
Cycle time reduction works similarly. An AI-powered loan approval system that cuts processing time from 5 days to 2 days doesn't save money directly. Still, it enables you to process more applications with the same team, handle seasonal peaks without hiring additional staff, and improve customer satisfaction, which in turn reduces churn.
Quality improvements also create indirect value. An AI system that reduces customer support escalations by 40% means your senior team spends less time on complex cases, even though you didn't eliminate any positions.
Strategic Value
Strategic value positions your business for future opportunities or competitive advantages that don't show up in quarterly results but matter for long-term success.
Opportunity enablement means AI unlocks business models that weren't viable before. A retailer using AI for hyper-personalized marketing can enter niche markets that were too small to target manually. A logistics company with route optimization AI can promise delivery windows that competitors can't match, winning contracts they would have lost.
Decision quality improvement creates strategic value by reducing costly mistakes. A hiring AI that improves candidate selection by 15% means better team performance, lower turnover, and less money spent on repeated recruitment—but the full impact plays out over years, not quarters.
Scalability readiness is a strategic value in waiting. An AI system that handles 10,000 transactions today might handle 100,000 next year without proportional cost increases. You're not seeing the value yet, but you've removed a growth constraint.
Risk and Compliance Value
This is the value from problems that never happen. It's real money saved, but it requires estimating what would have occurred without the AI.
Cost avoidance examples:
- Fraud detection AI that prevents losses doesn't generate revenue—it stops money from disappearing
- Cybersecurity AI that blocks attacks avoids breach costs, legal fees, and reputation damage
- Predictive maintenance AI prevents equipment failures that would have caused production downtime
Compliance efficiency:
- AI that automates regulatory reporting reduces the cost of audits and lowers the risk of penalties
- Healthcare AI that flags potential HIPAA violations prevents fines that could reach millions
- Financial AI that monitors transactions for suspicious patterns avoids anti-money laundering penalties
The challenge with quantifying risk and compliance value is that it is subjective. You need to estimate: what would have happened without this AI? What's the probability of the bad event? What's the cost if it occurs? Then multiply the probability by the impact to get the expected value prevented.
A fraud detection system that stops 100 incidents worth an average of 5,000 each delivers 500,000 in direct value. But if it also prevents one major fraud event that had a 10% probability of occurring and would have cost 2 million, the risk value is 200,000 (10% × 2 million).
The World Economic Forum notes that AI is projected to generate $7 trillion in value through generative AI capabilities, potentially boosting US labor productivity by 0.5-0.9% annually through 2030—demonstrating the scale of strategic value at stake.
KPIs That Actually Measure AI Project Success
The right KPIs depend on what your AI project is designed to accomplish. Financial metrics matter most to executives and finance teams, operational metrics prove the system works in practice, and model performance metrics connect technical quality to business outcomes. Gartner surveys show 77% of CIOs expect AI to improve productivity and efficiency, while 50% believe it will reduce costs, making it critical to track both operational and financial KPIs to capture full AI value.
Financial KPIs for AI Projects
| KPI | Definition | How to Measure | Business Relevance |
|---|---|---|---|
| Cost Reduction Percentage | The proportion of costs eliminated or avoided compared to baseline operations before AI deployment | (Baseline Costs - Current Costs) / Baseline Costs × 100 | Shows direct savings from automation or efficiency gains. A customer service AI reducing support costs by 35% directly impacts operating margins. |
| Revenue Uplift | Additional revenue generated attributable to AI-driven improvements in sales, pricing, or customer experience | (Revenue with AI - Baseline Revenue) / Baseline Revenue × 100 | Demonstrates top-line growth impact. An e-commerce recommendation engine increasing revenue by 12% proves commercial value beyond cost savings. |
| Margin Improvement | Change in profit margin resulting from AI optimization of pricing, inventory, or resource allocation | (New Margin % - Baseline Margin %) | Shows bottom-line impact more clearly than revenue alone. AI that increases margins from 18% to 22% delivers compounding returns as volume grows. |
| Cost Per Transaction | Average cost to complete a business process or transaction with AI versus manual methods | Total Process Costs / Number of Transactions | Reveals operational efficiency at scale. If AI reduces loan processing costs from $45 to $12 per application, the savings multiply across thousands of transactions. |
| ROI Percentage | Net return on AI investment over a defined period | (Total Value - Total Investment) / Total Investment × 100 | The ultimate financial metric for justifying continued investment. 150% ROI over 18 months typically justifies expansion; negative ROI signals the need for a pivot or shutdown. |
| Payback Period | Time required for cumulative AI value to equal total investment | Months until Cumulative Value = Total Investment | Critical for cash flow planning. A 6-month payback is attractive; 24+ months requires strong strategic justification beyond immediate returns. |
| Cost Avoidance | Estimated losses or expenses prevented by AI risk mitigation or quality improvements | (Probability of Loss Event × Cost of Event) - AI System Cost | Quantifies value from fraud prevention, quality control, or compliance. A fraud detection system preventing $800,000 in losses against $200,000 in costs shows clear value. |
Operational KPIs for AI Projects
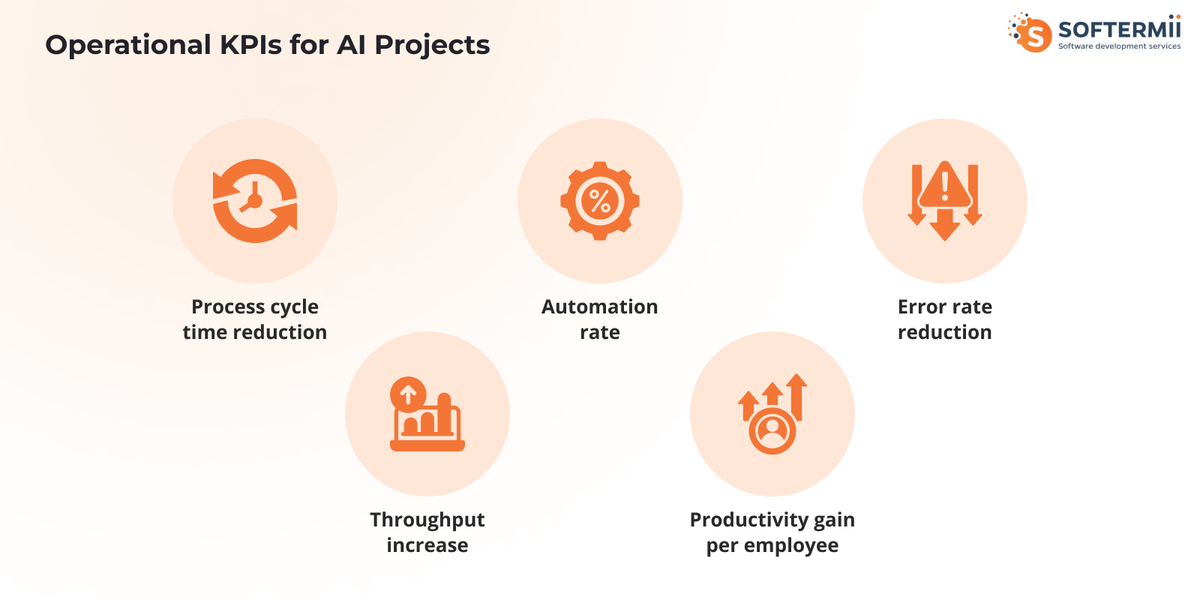
Operational KPIs prove your AI system delivers value in day-to-day work. These metrics show whether the technology actually works at scale.
Process cycle time reduction measures how much faster work gets done. Compare how long a process took before AI versus after. If insurance claims went from 8 days to 2 days, that's a 75% reduction. Faster processing means you handle more volume with the same team and respond to customers more quickly.
Automation rate shows what percentage of work AI handles alone. Divide automated tasks by total tasks and multiply by 100. An invoice system with 70% automation means 30% still need human review. This tells you where the AI works well and where it needs help.
Error rate reduction compares mistakes before and after AI. If manual data entry has 5% errors and AI reduces them to 0.3%, you cut errors by 94%. Every error costs money to fix and creates customer problems.
Throughput increase measures how much more work you can do. An AI warehouse going from 5,000 to 8,000 orders daily is a 60% increase. You get more output from the same space and people.
Productivity gain per employee shows how AI makes workers more effective. If analysts completed 8 reports weekly and now do 15, that's 88% more productive. They have time to do better work or can handle more clients without hiring additional staff.
AI Model & System KPIs (Business-Focused)
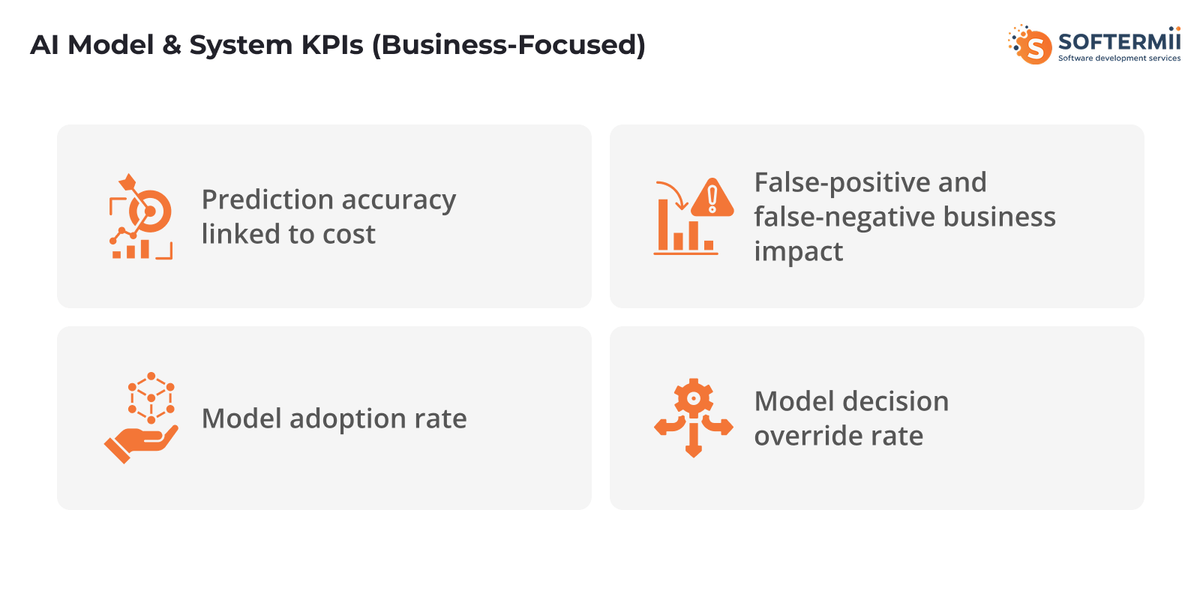
These metrics connect how well your AI works to actual business results. Technical accuracy matters only when it affects costs, revenue, or risk.
Prediction accuracy linked to cost goes beyond percentages. An 85% accurate credit model sounds good, but what about the 15% it gets wrong? If rejecting good customers costs 500,000 monthly and approving bad ones results in 200,000 in defaults, you need to focus on the costlier error. Track the dollar impact of right and wrong predictions.
False-positive and false-negative business impact breaks down errors by their cost. In fraud detection, false positives block real transactions and annoy customers—maybe 50 each in service costs. False negatives let fraud through at 1,200 per incident. A model with 2% false positives and 0.5% false negatives needs evaluation based on which error costs more at your volumes.
Model adoption rate measures how often people actually use AI recommendations. If your sales team receives 1,000 AI leads monthly but follows up on only 400, adoption is 40%. Low adoption means users don't trust it or it doesn't help them. High adoption means the AI earned their confidence.
Model decision override rate shows how often humans reject AI suggestions. A 30% override rate means problems—the model misses context, users don't trust it, or recommendations don't fit reality. Override patterns show where human judgment still matters most.
Strategic & Long-Term KPIs
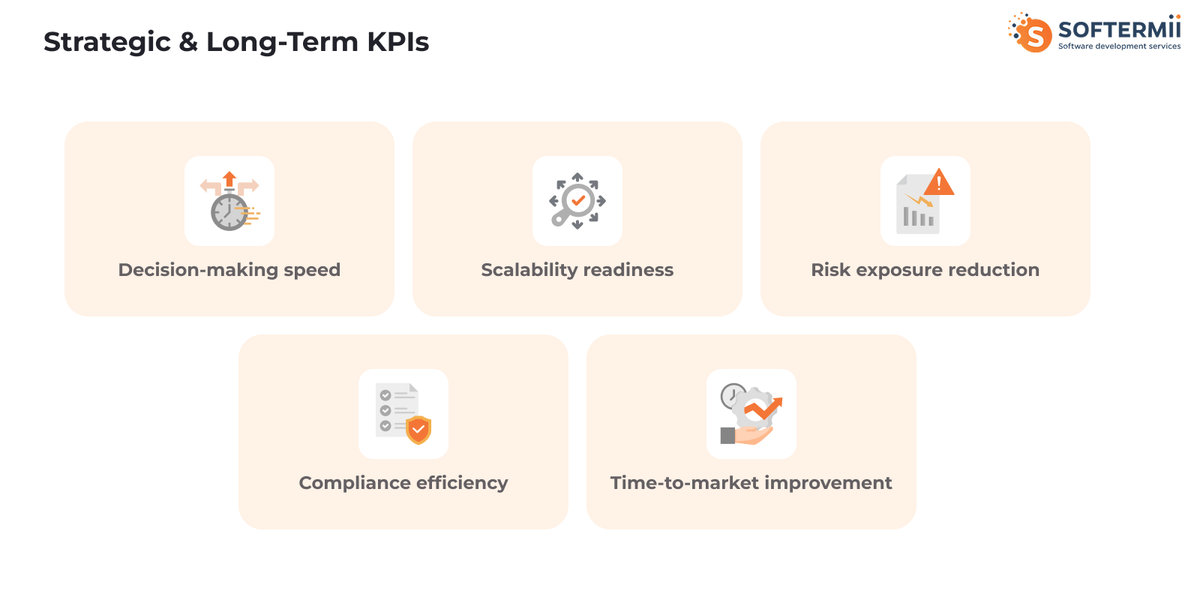
Strategic KPIs measure value that builds over time or sets you up for future wins. These matter most when thinking beyond this quarter.
Decision-making speed measures how much faster you can act. If decisions that took 3 weeks now take 3 days with AI, you compressed the cycle by 85%. In fast markets, slow decisions mean missed chances.
Scalability readiness asks: Can you handle 10x growth without 10x costs? A system handling 50,000 transactions daily and scaling to 500,000 with only 30% more cost is ready to grow. You won't need to rebuild when business expands.
Risk exposure reduction measures the potential losses you prevented. Manufacturing AI that predicts equipment failures reduces the risk of downtime. Calculate expected losses before AI versus after. Dropping annual risk from 2 million to 400,000 is an 80% reduction.
Compliance efficiency tracks the resources needed to meet regulations. AI that automates reporting might cut audit prep from 200 hours to 40 hours and reduce violation risks that could carry millions in penalties.
Time-to-market improvement shows how much faster you launch or adapt. AI drug discovery cutting timelines from 5 years to 3 means you reach revenue 2 years earlier. In software, 40% faster feature development lets you beat competitors to market.
Measuring ROI from AI by Industry
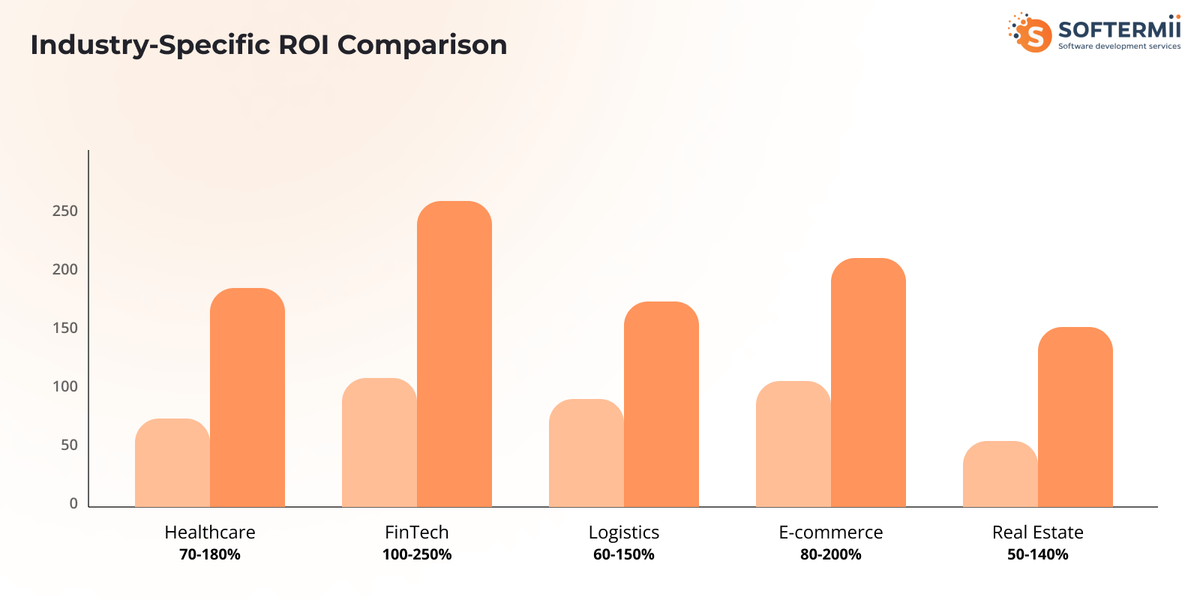
AI ROI looks different across industries because the value drivers, cost structures, and measurement timelines vary. Here's how to calculate returns in five major sectors.
Healthcare AI ROI
According to HIMSS research, 42% of healthcare leaders use AI for predictive analytics. However, adoption lags in other high-value areas, such as chart summarization (35%) and care coordination (33%), suggesting significant untapped ROI potential.
Reduced administrative workload shows up as fewer hours spent on scheduling, billing, and documentation. An AI system that automates prior authorization requests can save clinical staff 15-20 hours per week. At an average loaded cost of 35 per hour for administrative staff, that's 27,000 to 36,000 annually per staff member. Multiply across a 50-person team, and you're saving over 1 million yearly.
Faster diagnostics translates to higher patient volume and better outcomes. AI radiology tools that reduce image analysis time from 30 minutes to 5 minutes allow radiologists to read 40% more scans daily. A radiology department processing 200 scans daily can handle 280 without adding staff. At 1д50 revenue per scan, that's an additional 12,000 daily or 4.3 million annually.
Improved patient throughput means the same facility serves more patients. AI-powered triage and bed management systems that reduce emergency room wait times by 25% can increase patient volume by 15-20%. A mid-size hospital generating 100 million annual revenue could add 15-20 million by eliminating bottlenecks.
Reduced readmission risk directly cuts penalties and improves margins. Medicare penalizes hospitals with high readmission rates—fines can reach 3% of total Medicare payments. An AI system that predicts high-risk patients and triggers intervention protocols, reducing 30-day readmissions from 18% to 14%, saves both penalty costs and the 15,000 average cost per readmission. For a hospital with 5,000 annual discharges, preventing 200 readmissions saves 3 million.
Market analysis shows health systems are seeing the clearest ROI in ambient clinical documentation ($600M market) and coding/billing automation ($450M), with 85% of healthcare GenAI spending flowing to startups in these areas.
FinTech AI ROI
Fraud loss reduction is the most direct ROI metric in financial services. AI fraud detection that catches 95% of fraudulent transactions, compared with 75% for rule-based systems, prevents massive losses. A payment processor handling 10 billion in annual volume with a 0.15% fraud rate loses 15 million yearly. Improving detection to reduce fraud losses to 0.08% saves 7 million annually. Subtract the 800,000 AI system cost, and you have 775% ROI in year one.
Faster onboarding increases conversion and reduces abandonment. Traditional account opening takes 15-20 minutes with 40% abandonment rates. AI-powered KYC and document verification cuts this to 3-5 minutes with 15% abandonment. For a fintech acquiring 50,000 customers monthly, reducing abandonment from 40% to 15% means 12,500 additional customers monthly. At a 200 customer lifetime value, that's 2.5 million additional monthly revenue or 30 million annually.
Lower compliance costs come from automated monitoring and reporting. Manual AML transaction reviews cost 25-40 per alert, with millions generated monthly. AI that reduces false-positive alerts by 60% dramatically cuts review costs. A bank generating 100,000 monthly alerts at 30 per review spends 3 million monthly. Reducing false positives by 60% saves 1.8 million monthly or 21.6 million annually.
Reducing manual reviews in loan underwriting accelerates decision-making and reduces labor costs. AI that automates 70% of loan applications lets underwriters focus on complex cases. A lender processing 10,000 applications monthly at 45 per manual review spends 450,000 monthly. Automating 70% saves 315,000 monthly or 3.78 million annually, while approving loans 5 days faster improves customer satisfaction and reduces abandonment.
Logistics & Supply Chain AI ROI
Route optimization savings reduce fuel costs and driver hours. AI that cuts average route distance by 8-12% directly saves fuel and wages. A fleet of 200 trucks driving 100,000 miles annually at 6 per gallon and 3.50 per gallon spends 11.67 million on fuel. A 10% route reduction saves 1.17 million in fuel alone. Add reduced overtime and vehicle wear, and total savings reach 2-3 million annually.
Demand forecast accuracy prevents both stockouts and overstock. Improving forecast accuracy from 75% to 90% cuts safety stock requirements by 30-40% while reducing stockouts by 60%. A distributor holding 50 million in inventory can reduce this to 35 million, freeing 15 million in working capital. At 8% cost of capital, that's 1.2 million in annual savings. Preventing stockouts worth 5 million in lost sales adds another 5 million in value.
Inventory cost reduction comes from better placement and replenishment. AI that optimizes warehouse locations and predicts SKU velocity reduces carrying costs and expedited shipping. A retailer spending 8 million annually on expedited shipping to cover stockouts can cut this by 50% with better inventory positioning. Combined with 20% lower carrying costs from reduced inventory levels, total savings reach 5-7 million annually.
E-commerce AI ROI
Conversion rate uplift from personalized recommendations and search delivers direct revenue growth. AI that increases conversion from 2.3% to 2.8% means 21.7% more sales from the same traffic. An e-commerce site with 5 million monthly visitors and 100 average order value grows from 11.5 million to 14 million monthly revenue, an additional 2.5 million monthly or 30 million annually.
Average order value growth through product bundling and upsell recommendations adds revenue per transaction. AI that increases AOV from 100 to 115 through intelligent recommendations delivers 15% revenue growth without additional traffic. On 100,000 monthly orders, that's an extra 1.5 million monthly or 18 million annually with minimal additional cost.
Customer retention improvement has compounding effects. AI-powered personalization and predictive support that increases repeat purchase rates from 25% to 35% dramatically boost lifetime value. With 50,000 new customers monthly at a 500 lifetime value, improving retention from 25% to 35% over 24 months adds 15 million in retained customer value. The longer the retention improvement holds, the more value compounds.
Real Estate AI ROI
Lead qualification efficiency lets agents focus on buyers ready to transact. AI that scores leads and predicts the probability of closing can increase agent productivity by 40-60%. An agent spending 20 hours per week on unqualified leads and redirecting that time to qualified prospects can close 3-4 additional deals per month. At 15,000 average commission per deal, that's an extra 45,000 to 60,000 monthly per agent or 540,000 to 720,000 annually.
Pricing accuracy prevents money left on the table and reduces time on market. AI valuation models that predict optimal listing prices within 3% versus 8% of the traditional method sell properties 15-20 days faster and capture 2-3% more value. On a 500,000 property, 2.5% better pricing equals 12,500 more value. A brokerage selling 200 properties annually captures an additional 2.5 million in client value, strengthening its reputation and referrals.
Vacancy reduction in property management directly impacts NOI. AI that predicts tenant churn 90 days in advance and triggers retention or rapid re-leasing cuts the average vacancy from 8% to 5%. For a portfolio of 1,000 units at 1,500 monthly rent, reducing vacancy by 3 percentage points adds $540,000 in annual revenue with minimal additional cost—nearly pure profit improvement.
See detailed ROI benchmarks for your specific industry View Industry Report
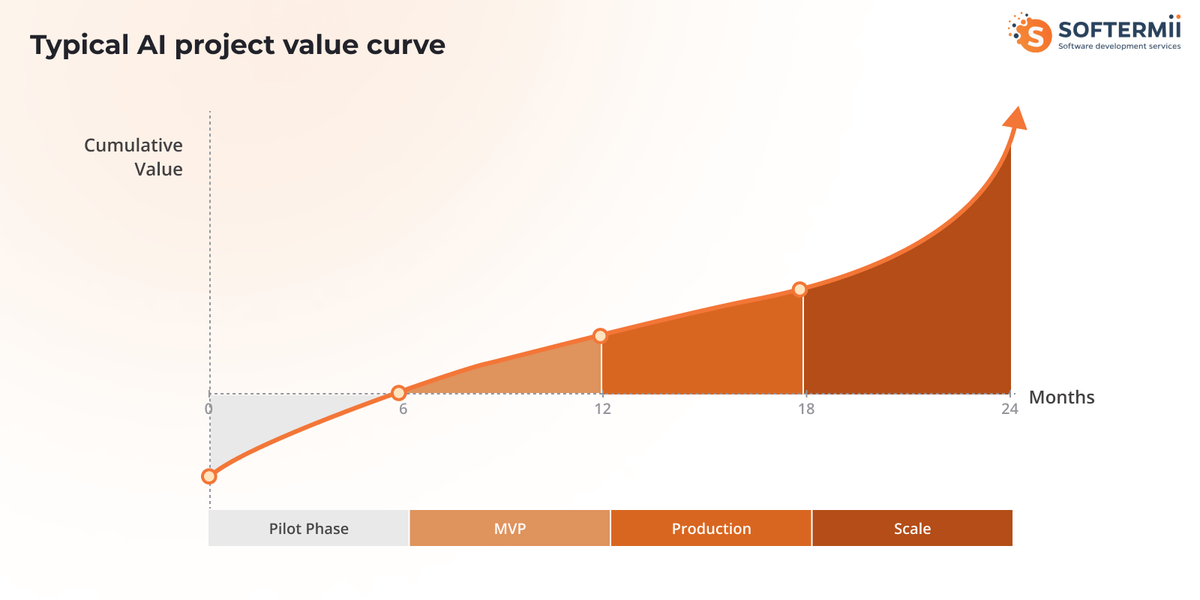
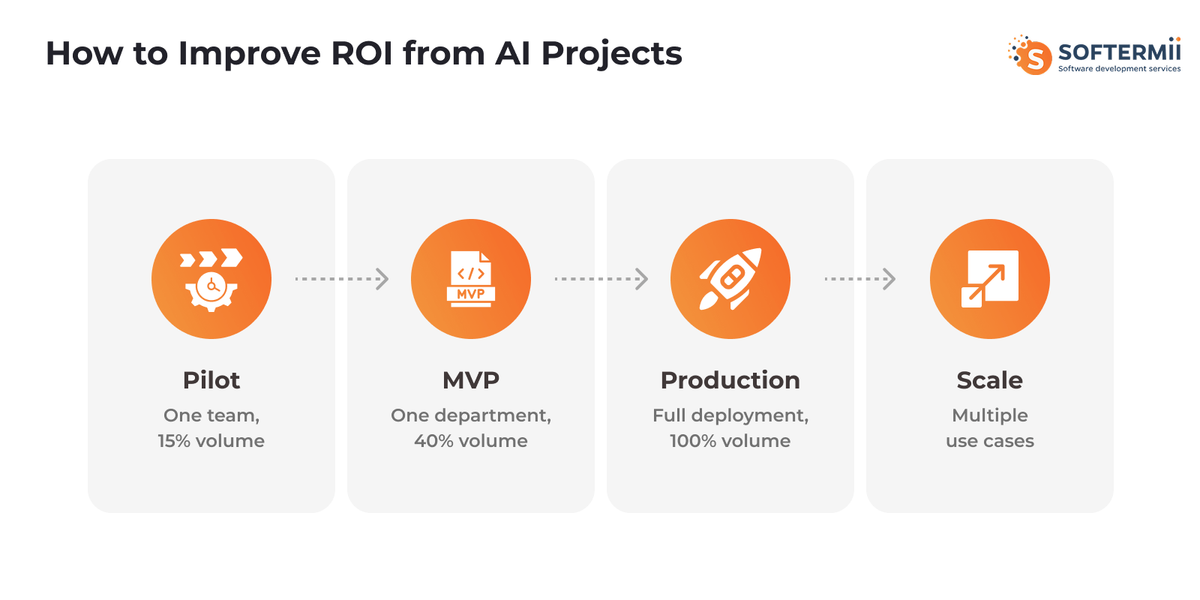
ROI Timeline: When AI Projects Start Delivering Value
AI projects don't deliver returns on day one. Value arrives in stages as the system moves from testing to production to scale. Understanding this timeline prevents unrealistic expectations and helps you know when to measure results.
| Phase | Timeline | Expected ROI | What's Happening | Key Metrics to Track |
|---|---|---|---|---|
| Pilot Phase | 3-6 months | 0% to -100% (net cost) | Testing feasibility, building initial model, training on limited data, proving concept works | Model accuracy on test data, user feedback, technical validation |
| MVP Phase | 6-12 months | 10-30% ROI | Live with real users but limited scope, gathering production data, improving the model | Early cost savings, process improvements, adoption rates |
| Production Phase | 12-18 months | 50-150% ROI | Fully deployed across target operations, model refined with production data, processes optimized | Full financial impact, operational efficiency gains, error reduction |
| Scale Phase | 18+ months | 150-400%+ ROI | Expanded to additional use cases/departments, compounding returns as volume grows | Cumulative value, expanded benefits, strategic advantages |
Deloitte research confirms this extended timeline, finding that most organizations achieve satisfactory AI ROI within 2-4 years—significantly longer than the typical 7-12 month payback period for traditional technology investments.
Pilot Phase (Months 0-6): Investment Without Returns
The pilot phase costs money without generating measurable ROI. You're building infrastructure, preparing data, developing initial models, and testing with a small user group. Budget 100,000 to 500,000, depending on complexity, with zero financial returns expected.
What matters here isn't ROI—it's proof of concept. Can the AI solve the problem? Does it work with your data? Will users adopt it? A successful pilot shows technical feasibility and user acceptance, setting the stage for actual value delivery.
Don't try to calculate ROI yet. Track model performance metrics and gather user feedback instead. The goal is to validate assumptions before committing to full production investment.
MVP Phase (Months 6-12): First Returns Appear
The MVP phase is when you see initial ROI, typically 10-30%. The AI is live but limited—maybe handling one department, one product line, or one customer segment. You're still learning and adjusting, but real value starts flowing.
A customer service chatbot handling 30% of inquiries might save 50,000 in labor costs against 150,000 in development and infrastructure costs. That's negative in the first six months but approaches 30% ROI by month twelve as savings accumulate and costs stabilize.
This phase requires patience. Early returns seem small compared to the investment, but the learning happening now determines whether you reach strong production ROI. Focus on improving model performance, increasing adoption, and identifying expansion opportunities.
Production Phase (Months 12-18): Full Value Realization
Production phase delivers 50-150% ROI as the AI runs at full scale with refined models and optimized processes. You've worked through implementation issues, users trust the system, and business processes have been adapted to leverage AI effectively.
That same chatbot now handles 70% of inquiries with higher accuracy, saving 300,000 annually against a total investment (including pilot and MVP) of 250,000. You hit 120% ROI, and the system runs with minimal incremental cost.
Organizations meeting or exceeding ROI expectations typically reach this milestone by the production phase. Deloitte found that 74% of companies with advanced AI initiatives report meeting or exceeding ROI expectations, with 20% achieving returns above 30%.
This is where most organizations should expect to justify their AI investment. If you're not seeing 50%+ ROI by 18 months, something went wrong—poor model performance, low adoption, or the wrong problem choice.
Scale Phase (18+ Months): Compounding Returns
The scale phase generates 150-400%+ ROI as you expand AI to adjacent problems and compound benefits across the organization. The infrastructure exists, the team learned how to implement AI successfully, and you're applying those capabilities more broadly.
The chatbot expands to multiple languages and product lines, now handling 85% of inquiries across three departments. Annual savings reach 800,000 against a cumulative investment of 350,000—a 229% ROI that grows each year. You also use the same platform for email automation and social media responses, multiplying returns without proportional cost increases.
Strategic benefits emerge here, too. Faster decision-making, better customer experience, and competitive advantages that don't show up in immediate ROI calculations but position you for long-term success.
Key Factors That Accelerate ROI
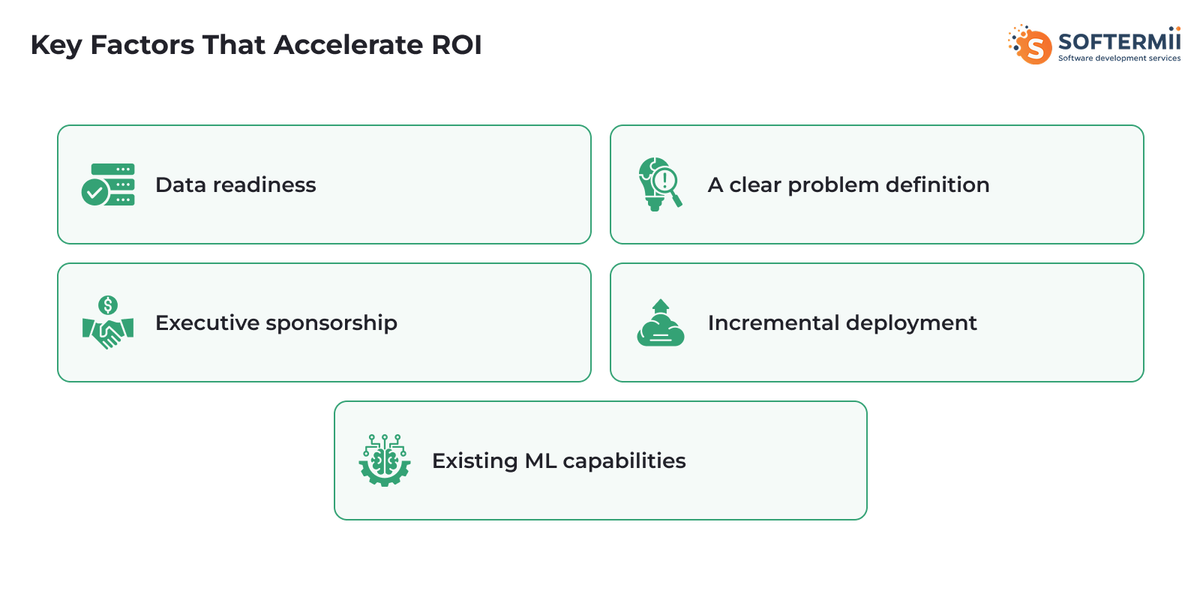
Data readiness is the biggest accelerator. Organizations with clean, accessible, well-structured data can move through pilot to production in 9-12 months instead of 18-24 months. Every month of delayed data preparation pushes ROI realization further out.
A clear problem definition speeds everything up. AI projects targeting specific, measurable problems, such as "reduce invoice processing time by 40%," achieve ROI faster than vague goals like "improve customer experience." Specific problems have clear success metrics and faster validation.
Executive sponsorship removes roadblocks. When leadership actively supports AI adoption, budget approvals happen faster, users adopt more readily, and organizational resistance disappears. Projects with strong executive backing reach production ROI 30-40% faster than those without.
Incremental deployment paradoxically speeds ROI by reducing risk. Rolling out to one team first, proving value, then expanding beats trying to deploy everywhere at once. You learn faster, adjust quicker, and build momentum through early wins.
Existing ML capabilities dramatically accelerate timelines. Organizations with data science teams, ML infrastructure, and AI experience move 2-3x faster than those building from scratch. Your second AI project reaches ROI much faster than your first.
Key Factors That Delay ROI
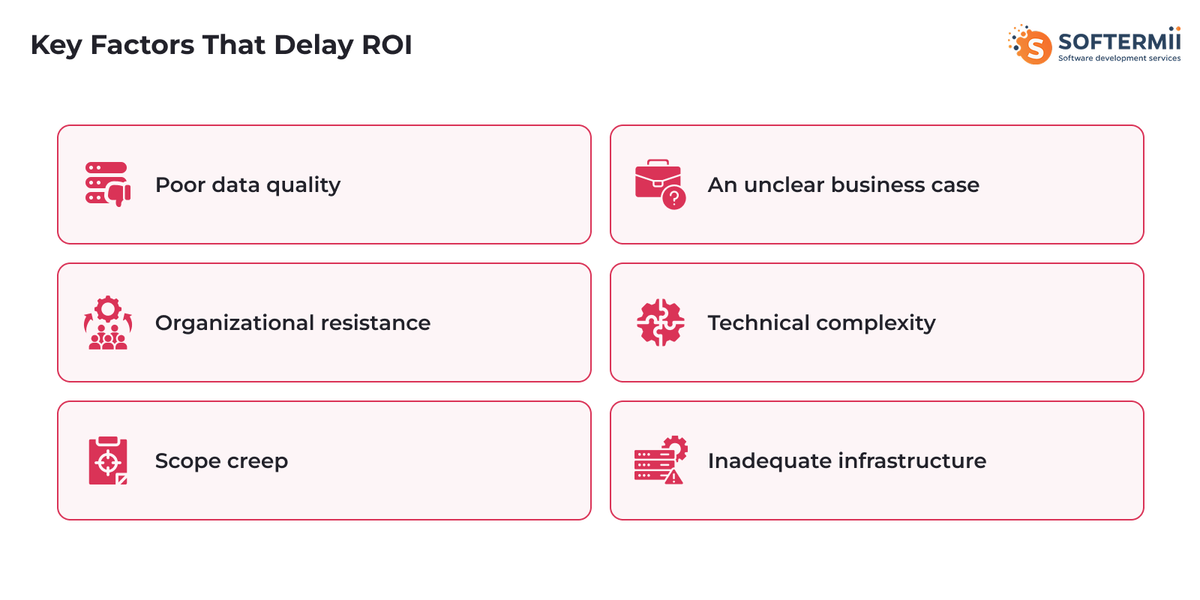
Poor data quality is the number one delay. If you discover 6 months in that your data is incomplete, inconsistent, or inaccurate, you're starting over. Data problems can push production deployment back 6-12 months and kill projects entirely.
An unclear business case means moving targets. Projects that start without defined success metrics waste time debating what counts as value. ROI stays elusive when no one agrees upfront on what you're measuring.
Organizational resistance slows adoption. If users don't trust the AI, refuse to change workflows, or actively work around it, you'll never realize the projected ROI. Change management failures turn technically successful projects into business failures.
Technical complexity extends timelines when requirements exceed your team's capabilities. Building custom models for novel problems takes longer than applying proven techniques to common use cases. Complex projects need 24-36 months to reach a strong ROI.
Scope creep resets the clock. Every time you add "just one more feature" or expand to "slightly different use cases," you delay production deployment. Disciplined scope management keeps ROI timelines on track.
Inadequate infrastructure creates bottlenecks. If your cloud environment can't handle production loads, your data pipelines break under volume, or your APIs can't support real-time predictions, you'll spend months fixing infrastructure instead of delivering value.
The organizations seeing the fastest ROI treat AI implementation as a business transformation project, not just a technology deployment. They prepare data early, define success clearly, secure executive support, and deploy incrementally with strong change management.
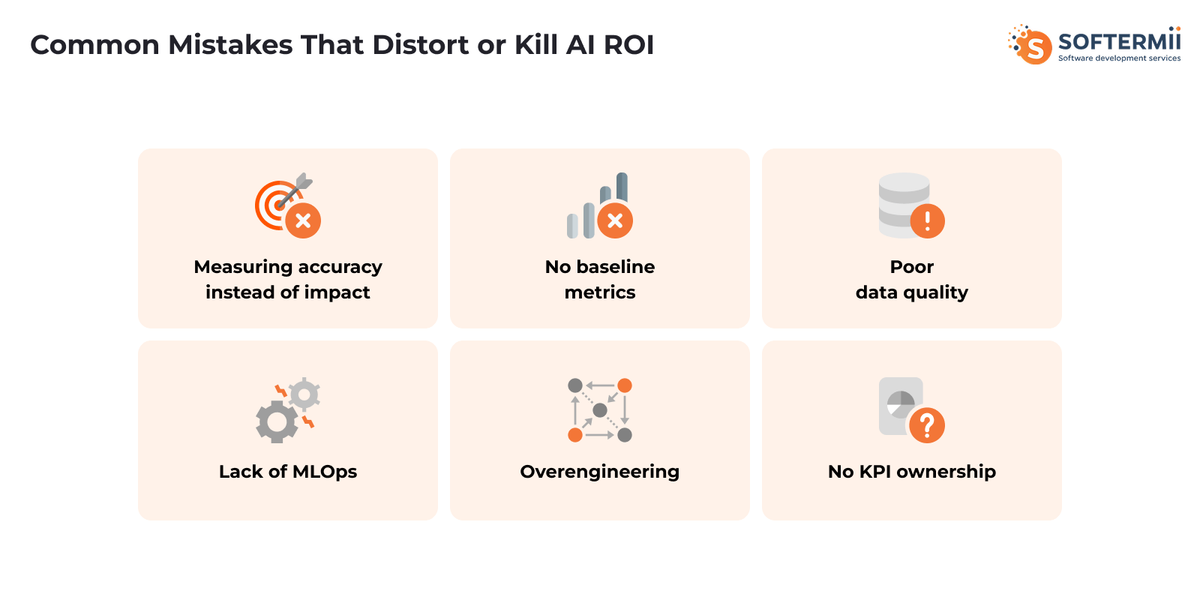
Common Mistakes That Distort or Kill AI ROI
Most failed AI projects don't fail because of bad technology. They fail because organizations measure the wrong things, skip critical groundwork, or build systems nobody can maintain.
Research from the World Economic Forum highlights the severity of these mistakes, citing an MIT study showing that 95% of enterprise AI initiatives fail. The successful 5% focus on human enablement, strategic alignment, and disciplined execution—avoiding the common pitfalls that derail most projects. Here are the mistakes that destroy AI ROI before it can materialize.
Measuring Accuracy Instead of Impact
A credit model with 92% accuracy sounds impressive until you realize it's costing you millions in lost revenue. High accuracy means nothing if the model optimizes for the wrong outcome.
The mistake happens when data scientists focus on technical metrics—accuracy, precision, F1 scores—without connecting them to business results. A fraud detection model might achieve 95% accuracy but generate so many false positives that customers abandon transactions. You blocked 5% more fraud but lost 15% of legitimate sales. The model succeeded technically but failed commercially.
What matters is business impact. Does the model increase revenue? Reduce costs? Prevent losses? A model with 85% accuracy, calibrated to minimize false positives, might deliver better ROI than a 95% accurate model that frustrates customers. Always measure the dollar impact of predictions, not just whether predictions are correct.
No Baseline Metrics
You can't measure improvement if you don't know where you started. Organizations launch AI projects without documenting current performance, making ROI calculation impossible.
A logistics company implements route optimization AI and claims 20% fuel savings. But they never measured actual fuel consumption before AI deployment. Was it really 20% savings, or was it 5%? It could be 40%, and they're undervaluing the system. Without baseline data, you're guessing.
Establish baselines before starting AI development. Measure current costs, cycle times, error rates, and revenue for at least 3-6 months. Document seasonal variations and one-time events. When AI goes live, you'll have solid comparison data showing real impact. Baseline measurement adds 2-4 weeks to project timelines but makes ROI calculation credible and defensible.
Poor Data Quality
Bad data kills AI projects faster than any other factor. The model can only learn from the data you give it, and garbage in means garbage out.
Poor data quality shows up in multiple ways. Missing values force the model to guess or ignore records. Inconsistent formats—dates as "12/25/2025" in one system and "2025-12-25" in another—create noise. Duplicate records skew patterns. Outdated information trains the model on a reality that no longer exists. Biased historical data teaches the model to perpetuate past mistakes.
A retail AI trained on inventory data with 30% missing cost information learned incorrect patterns about product profitability. The recommendations looked good technically, but sent buyers toward low-margin products. Six months of poor purchasing decisions cost 2 million before anyone traced it back to data quality.
Fix data quality before building models, not after. Budget 40-60% of your AI project timeline for data cleaning, validation, and preparation. It's unglamorous work but essential. Organizations that skip data quality work end up rebuilding models multiple times, pushing ROI realization back 12-18 months or abandoning projects entirely.
Lack of MLOps
MLOps—the systems and processes for deploying, monitoring, and maintaining AI models in production—is where most AI projects die after launch. You built a great model, deployed it successfully, and then watched performance decay over time because nobody maintained it.
Models drift as the world changes. A demand forecasting model trained on 2023 data performs poorly in 2025 because customer behavior has shifted. Fraud patterns evolve as criminals adapt. Without monitoring and retraining, your AI gradually stops working, and nobody notices until the damage is done.
Lack of MLOps means no version control for models, no automated retraining pipelines, no performance monitoring, no rollback procedures when updates fail. Data scientists build models but can't deploy updates without IT involvement, which takes weeks. Production issues go undetected because no one monitors model performance dashboards.
The ROI impact is severe. Models that could deliver 150% ROI over three years deliver 40% because performance degrades unchecked. You keep investing in maintenance without systematic processes, doubling operational costs. Eventually, you abandon the AI and rebuild from scratch, resetting your ROI timeline to zero.
Build MLOps infrastructure before deploying AI to production. Budget 20-30% of development costs for deployment pipelines, monitoring systems, and retraining automation. Treat AI as a living system that needs continuous care, not as a one-time project you build and forget.
Overengineering
Building a sophisticated deep learning system when simple logistic regression would work wastes money and delays value. Overengineering happens when teams prioritize technical elegance over business results.
A financial services company spent 18 months building a custom neural network for loan approval, investing 2 million in development. A simpler decision tree model would have delivered 90% of the value in 4 months for 300,000. They optimized for technical sophistication instead of business ROI, pushing payback from 8 months to 36 months.
Overengineering shows up as: custom models when pre-trained models exist, building from scratch when vendor solutions work, real-time inference when batch processing suffices, complex architectures when simple ones perform adequately. Each unnecessary complexity adds cost and delays deployment.
Start simple. Use the simplest model that adequately solves the problem. Deploy it fast, prove value, then optimize if needed. A logistic regression model in production delivering 100,000 annual value beats a sophisticated neural network still in development delivering zero. You can always upgrade later once cash flow from the simple version funds improvements.
No Ownership of KPIs
AI projects fail when nobody owns the business results. The data science team measures model accuracy, IT tracks uptime, but no single person is accountable for whether the AI delivers ROI.
This creates responsibility gaps. The model works technically, and the infrastructure runs reliably, but adoption remains low because product teams haven't made it accessible. Revenue doesn't improve because sales teams don't trust the recommendations. Costs don't drop because operations never changed workflows. Everyone did their job, but the business outcome failed.
Without KPI ownership, projects drift. Meetings focus on technical metrics because those have owners. Business impact discussions become vague because no one's bonus depends on hitting targets. When ROI disappoints, no one takes responsibility because no one was responsible.
Assign a single executive owner for each AI project's business outcomes before starting development. This person owns the ROI number and has the authority to make decisions about scope, resources, and deployment. They connect technical teams to business reality and ensure someone fights for adoption, workflow changes, and measurable results.
Their compensation should tie partly to AI project success. If the chatbot needs to reduce support costs by $200,000 annually, the owner's bonus depends on hitting that number. This aligns incentives and ensures someone pushes through organizational resistance to realize value.
Deloitte research reinforces this point, finding that organizations with tech-focused AI approaches are 1.6x more likely to report investments not meeting expectations compared to those who redesign work processes around AI, highlighting the importance of business ownership over technical deployment.
AI ROI Templates & Practical Measurement Frameworks
These templates give you ready-to-use frameworks for calculating and tracking AI ROI. Copy them into spreadsheets, adapt them to your project, and use them to justify investment or measure ongoing performance.
ROI Calculation Table
This template calculates your AI project's return on investment over 24 months. Customize the numbers based on your specific project.
| Cost Category | Month 0-6 | Month 7-12 | Month 13-18 | Month 19-24 | Total |
|---|---|---|---|---|---|
| Infrastructure & Tools | 50,000 | 10,000 | 10,000 | 10,000 | 80,000 |
| Data Preparation | 40,000 | 15,000 | 5,000 | 5,000 | 65,000 |
| Model Development | 80,000 | 40,000 | 20,000 | 10,000 | 150,000 |
| Integration & Deployment | 30,000 | 50,000 | 10,000 | 5,000 | 95,000 |
| Training & Change Management | 20,000 | 30,000 | 10,000 | 5,000 | 65,000 |
| Ongoing Operations | 5,000 | 15,000 | 15,000 | 15,000 | 50,000 |
| Total Investment | 225,000 | 160,000 | 70,000 | 50,000 | 505,000 |
| Value Category | Month 0-6 | Month 7-12 | Month 13-18 | Month 19-24 | Total |
| Cost Savings | 0 | 40,000 | 120,000 | 150,000 | 310,000 |
| Revenue Increase | 0 | 30,000 | 90,000 | 120,000 | 240,000 |
| Productivity Gains | 0 | 20,000 | 60,000 | 80,000 | 160,000 |
| Risk/Loss Prevention | 0 | 15,000 | 40,000 | 50,000 | 105,000 |
| Total Value | 0 | 105,000 | 310,000 | 400,000 | 815,000 |
| Cumulative Investment | 225,000 | 385,000 | 455,000 | 505,000 | |
| Cumulative Value | 0 | 105,000 | 415,000 | 815,000 | |
| Net Value | -225,000 | -280,000 | -40,000 | 310,000 | |
| ROI % | -100% | -73% | -9% | 61% |
How to use this template:
- Enter your actual costs in each category based on vendor quotes and resource estimates
- Project value based on baseline metrics and improvement targets
- Update actuals monthly as the project progresses
- Calculate payback period (when cumulative value exceeds cumulative investment)
- Adjust future projections based on early performance data
KPI Tracking Table
Use this template to monitor key performance indicators throughout your AI project lifecycle. Track both leading indicators (model performance) and lagging indicators (business results).
| KPI | Target | Baseline | Month 3 | Month 6 | Month 9 | Month 12 | Status |
|---|---|---|---|---|---|---|---|
| Financial KPIs | Financial KPIs | Financial KPIs | Financial KPIs | Financial KPIs | Financial KPIs | Financial KPIs | Financial KPIs |
| Cost Reduction % | 30% | 0% | 5% | 12% | 22% | 28% | On Track |
| Monthly Cost Savings | 25,000 | 0 | 3,000 | 8,000 | 18,000 | 23,000 | On Track |
| Revenue Uplift % | 15% | 0% | 2% | 6% | 11% | 14% | On Track |
| ROI % | 100% | -100% | -85% | -40% | 20% | 75% | On Track |
| Operational KPIs | Operational KPIs | Operational KPIs | Operational KPIs | Operational KPIs | Operational KPIs | Operational KPIs | Operational KPIs |
| Automation Rate % | 70% | 0% | 15% | 35% | 55% | 68% | On Track |
| Process Cycle Time (hours) | 4 | 12 | 10 | 8 | 5 | 4.2 | Achieved |
| Error Rate % | 0.5% | 4% | 3.2% | 2.1% | 0.9% | 0.6% | On Track |
| Throughput (daily volume) | 5,000 | 3,000 | 3,400 | 3,900 | 4,500 | 4,800 | Behind |
| Model Performance KPIs | Model Performance KPIs | Model Performance KPIs | Model Performance KPIs | Model Performance KPIs | Model Performance KPIs | Model Performance KPIs | Model Performance KPIs |
| Prediction Accuracy % | 90% | - | 82% | 87% | 89% | 91% | Achieved |
| Model Adoption Rate % | 80% | 0% | 25% | 45% | 65% | 78% | On Track |
| Decision Override Rate % | <15% | - | 35% | 25% | 18% | 16% | Behind |
| False Positive Rate % | <2% | - | 5% | 3% | 2.5% | 2.2% | Behind |
How to use this template:
- Set targets based on business requirements and ROI goals
- Measure baselines before AI deployment to enable comparison
- Update actuals monthly with data from production systems
- Flag status as: Achieved (exceeded target), On Track (within 10% of target), Behind (more than 10% below target), At Risk (trending in the wrong direction)
- Review monthly and adjust strategy when KPIs fall behind
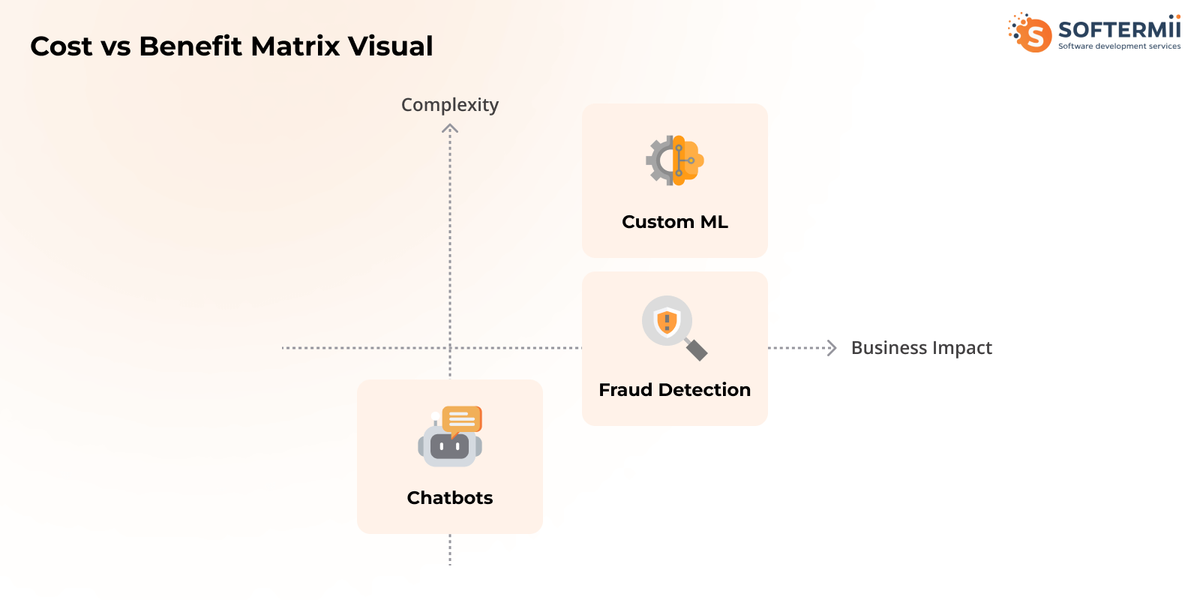
Cost vs Benefit Matrix
This matrix helps you evaluate whether AI is the right investment compared to alternatives. Use it during project planning to make go/no-go decisions.
| Factor | Do Nothing | Rule-Based Automation | AI Solution | Custom ML Solution |
|---|---|---|---|---|
| Initial Investment | 0 | 50,000 | 250,000 | 500,000 |
| Implementation Time | 0 months | 2 months | 6 months | 12 months |
| Annual Operating Cost | 0 | 10,000 | 30,000 | 60,000 |
| Year 1 Value | 0 | 80,000 | 120,000 | 100,000 |
| Year 2 Value | 0 | 85,000 | 200,000 | 250,000 |
| Year 3 Value | 0 | 85,000 | 280,000 | 400,000 |
| 3-Year Net Value | 0 | 140,000 | 320,000 | 290,000 |
| 3-Year ROI | 0% | 156% | 43% | 35% |
| Scalability | None | Low | High | Very High |
| Flexibility | None | Low | Medium | High |
| Maintenance Burden | None | Low | Medium | High |
| Risk Level | Low | Low | Medium | High |
| Recommended Choice | - | ✓ Best for quick wins | ✓ Best for growth | Only if strategic |
How to use this matrix:
- List all viable options, including doing nothing and simpler alternatives
- Estimate costs and benefits for each option over 3 years
- Calculate ROI for each approach
- Consider non-financial factors like scalability and risk
- Choose the option with the best risk-adjusted returns, not always the highest ROI
Simple ROI Calculator Formula
Use this formula structure in any spreadsheet tool:
Total Investment = Infrastructure + Development + Data Prep + Integration + Training + Operations (ongoing)
Total Value = Cost Savings + Revenue Increase + Productivity Gains + Risk Prevention
Net Value = Total Value - Total Investment
ROI Percentage = (Net Value / Total Investment) × 100
Payback Period = Total Investment / (Average Monthly Value)
Example calculation:
- Total Investment: 400,000
- Total Value (24 months): 680,000
- Net Value: 280,000
- ROI: (280,000 / 400,000) × 100 = 70%
- Payback Period: 400,000 / 28,333 monthly average = 14.1 months
Value Realization Tracker
Track when projected value actually materializes to understand your ROI timeline accuracy.
| Value Source | Projected Value | Projected Month | Actual Value | Actual Month | Variance | Notes |
|---|---|---|---|---|---|---|
| Support cost reduction | 150,000 | Month 12 | 132,000 | Month 14 | -12% | Adoption slower than expected |
| Sales productivity | 80,000 | Month 9 | 95,000 | Month 10 | +19% | Better than projected |
| Error reduction savings | 45,000 | Month 6 | 38,000 | Month 8 | -16% | Data quality issues delayed |
| Fraud prevention | 120,000 | Month 12 | 140,000 | Month 11 | +17% | Model exceeded expectations |
How to use this tracker:
- List each value source from your ROI calculation
- Record projected value and timing from your business case
- Update with actual results as they occur
- Calculate variance to improve future projections
- Use notes to capture why actuals differed from projections
These templates work in Excel, Google Sheets, or any spreadsheet tool. Adapt categories and time periods to match your project. The key is documenting assumptions, tracking actuals, and adjusting projections based on real performance data.
How to Improve ROI from AI Projects
Most AI projects underdeliver on ROI because teams skip critical planning steps or deploy in ways that limit value capture. These five practices dramatically improve your chances of achieving projected returns.
Start with the ROI Hypothesis
Define your expected return before writing any code. An ROI hypothesis states: "If we build X, then the Y metric will improve by Z amount, generating W value." This forces clarity about what success looks like and whether the juice is worth the squeeze.
A weak hypothesis sounds like: "AI will improve customer service." A strong hypothesis states: "An AI chatbot handling tier-1 support questions will reduce average resolution time from 12 minutes to 4 minutes, allowing our 15 support agents to handle 60% more tickets, eliminating the need for 3 planned hires and saving 180,000 annually."
The strong hypothesis specifies the mechanism (chatbot handles tier-1 questions), the metric (resolution time), the improvement target (12 to 4 minutes), and the financial impact (avoid 3 hires worth 180,000). You can now measure whether each assumption holds and adjust course when reality differs from the hypothesis.
Write your ROI hypothesis in a one-page document before starting development. Include current baseline metrics, improvement targets, mechanism of value creation, cost estimates, and timeline assumptions. Get agreement from stakeholders that if you hit these targets, the project succeeds. This prevents moving goalposts and ensures everyone defines success the same way.
Tie AI to One Business Metric
AI projects that chase multiple benefits rarely achieve any of them. Pick one primary metric—cost reduction, revenue growth, or risk prevention—and optimize everything around moving that number.
A retail company built recommendation AI targeting three goals: increase conversion rates, grow average order value, and improve customer retention. The model tried to balance all three, achieving mediocre results on each. They rebuilt, focusing solely on average order value, achieving an 18% improvement compared to the 6% they got by optimizing everything. Conversion and retention improved anyway as side effects.
Single-metric focus clarifies trade-offs. Should the model prioritize accuracy or speed? It depends on which matters more for your target metric. Should you launch with 80% coverage or wait for 95%? Again, depends on your primary goal. Multiple goals create paralysis; one goal creates clarity.
Choose the metric with the clearest financial impact and shortest measurement cycle. Revenue is usually more reliable than brand perception because it can be measured monthly. Cost reduction beats customer satisfaction because the causation is direct. Pick the metric that proves value fastest and use early wins to fund expanded scope later.
Prepare Data Before Modeling
Data preparation accounts for 50-70% of AI project time, yet organizations consistently underinvest here. They rush to model building with messy data, then spend months debugging issues that proper preparation would have prevented.
Start data work 3-6 months before model development. Identify required data sources, document quality issues, build pipelines to clean and transform data, create validation rules, and establish processes for ongoing data quality. Only start modeling when you have 6+ months of clean, consistent data ready to use.
A logistics company delayed its route optimization project by 4 months to fix address data quality. Addresses had inconsistent formats, missing geocodes, and duplicate entries. They cleaned historical data, implemented validation rules for new entries, and built automated geocoding. When modeling started, development took 3 months instead of the projected 9 months because the data was ready.
Budget 40-60% of project costs for data preparation. It feels like overhead, but it's the foundation that determines whether your AI delivers value or generates garbage. Organizations that invest upfront in data preparation reach production ROI 6-12 months faster than those that don't.
Roll Out AI Incrementally
Deploy AI to one team, one process, or one geography first. Prove value at a small scale, learn what works, then expand. Incremental rollout reduces risk, accelerates learning, and builds momentum through early wins.
A financial services company deployed fraud detection to one product line, which represents 15% of transaction volume. They learned the model generated too many false positives during holiday shopping peaks, adjusted the thresholds, and then rolled out to the remaining products. Total deployment took 8 months, but delivered positive ROI by month 4 because the limited rollout started generating value immediately.
Full-scale deployment from day one delays value and amplifies risk. If something goes wrong, you've disrupted the entire operation. If adoption is slow, you've invested in infrastructure nobody uses. Incremental rollout means you capture some value while perfecting the system, and you only scale what's proven to work.
Start with the highest-value, lowest-complexity use case. Get that working, measure ROI, fix issues, then expand to the next use case. Each expansion happens faster because you've learned from the previous one. By the time you reach full deployment, you've already achieved partial ROI and validated your assumptions.
Combine AI with Human Decision-Making
AI rarely delivers maximum value working alone. The highest ROI comes from AI recommendations that humans review, approve, or enhance. This hybrid approach catches errors, maintains trust, and handles edge cases AI struggles with.
Design workflows where AI handles volume and humans handle complexity. AI reviews 1,000 loan applications and auto-approves 600 clear cases, flags 300 for human review, and rejects 100 obvious problems. The humans focus their expertise on the 300 complex cases where judgment matters most. This delivers 60% automation (reducing costs) while maintaining quality on difficult decisions.
Build override mechanisms that let humans reject AI recommendations when they spot problems. Track override patterns to identify where the model needs improvement. A 5% override rate suggests the AI is working well; a 40% override rate means users don't trust it or that it's missing important context.
Train users to work effectively with AI. They need to understand what the AI is good at, where it struggles, and how to interpret confidence scores. Poorly trained users either ignore AI recommendations (wasting your investment) or trust them unquestioningly (amplifying errors). Well-trained users extract maximum value from AI while catching its mistakes.
When AI Is the Wrong Investment (And What to Do Instead)
Not every problem needs AI. Sometimes simpler solutions deliver better ROI with less risk and faster results. Here's when to choose alternatives over AI.
When Rule-Based Automation Is Better
If you can write clear if-then rules that handle 80%+ of cases, rule-based automation beats AI every time. It's cheaper, faster to build, easier to maintain, and completely transparent.
Rule-based systems work well for: invoice processing with standard formats, customer routing based on clear criteria, compliance checks with defined regulations, inventory reordering with fixed thresholds, and approval workflows with explicit policies.
A manufacturer considered AI for quality control but realized 90% of defects followed identifiable patterns. They built a rule-based system in 6 weeks for 40,000 that caught 88% of defects. An AI system would have cost 300,000, taken 6 months, and caught 92% of defects. The extra 4% wasn't worth 260,000 and 4.5 months of delayed value.
Use AI only when rules don't work—when patterns are subtle, when conditions constantly change, when you can't articulate the logic, or when you need to handle thousands of unique scenarios. If you can write the rules, skip the AI.
When Data Maturity Is Insufficient
AI needs high-quality data in sufficient quantity. Without it, you're building on quicksand. If your organization hasn't mastered basic data management, AI projects will fail at a high cost.
Signs of insufficient data maturity: no single source of truth, data scattered across incompatible systems, missing or inconsistent historical data, no data governance policies, IT can't provide data access in reasonable timeframes, and business users don't trust existing reports.
A healthcare provider sought AI for patient outcome prediction but discovered that their EHR data was 40% incomplete, diagnostic codes were inconsistent across facilities, and medication records contained duplicate entries. They shelved the AI project and spent 18 months fixing data infrastructure. Only then did AI become viable.
Before investing in AI, achieve basic data competency: a centralized data warehouse or lake, consistent data definitions and formats, documented data quality standards, established data governance, reliable data pipelines, and business users who trust the data. If you don't have these, invest in data infrastructure first. AI built on bad data is money burned.
When ROI Cannot Be Realistically Achieved
Some problems aren't worth solving with AI because the value created never exceeds the cost, or the benefits take too long to materialize for the investment to make sense.
AI can't achieve realistic ROI when: the problem affects too few transactions to generate meaningful savings, the improvement isn't valuable enough to justify costs, the measurable benefit timeline extends beyond 3-4 years, the organization lacks resources to maintain AI long-term, or simpler alternatives deliver 80% of the value at 20% of the cost.
A small law firm considered AI for contract review, but analyzed only 200 contracts annually. Even if AI saved 2 hours per contract at 150 per hour, annual savings would be 60,000. With implementation costs of 150,000 and annual maintenance costs of 20,000, ROI would take 3+ years and would depend on volume growth that might not occur. They hired a paralegal instead.
Run the ROI calculation honestly before committing. Include all costs: infrastructure, development, integration, training, maintenance, and the opportunity cost of executive attention. Project realistic benefits based on baseline metrics, not vendor promises. If the math doesn't work, don't do the project. There's no shame in determining AI isn't the right tool for your specific problem.
Summary: How to Measure ROI from AI Projects Correctly
Calculate ROI using total AI-driven value minus total investment, divided by total investment. Include all costs (infrastructure, development, data preparation, integration, operations) and all value (cost savings, revenue growth, productivity gains, risk prevention). Track both over a realistic timeframe that accounts for AI's gradual value realization.
Establish baseline metrics before deployment. Measure current performance for 3-6 months so you can prove what changed after AI implementation. Without baselines, ROI calculations are guesswork, and stakeholders won't trust your numbers.
Track financial, operational, and strategic KPIs together. Financial metrics like cost reduction and revenue uplift justify the investment. Operational metrics such as automation rate and cycle time demonstrate that the system works. Strategic metrics such as scalability readiness demonstrate long-term positioning. You need all three perspectives to understand ROI in full.
Expect zero returns during the pilot phase, 10-30% ROI by month 12, and 50-150% ROI by month 18. AI value arrives gradually as models improve with production data and organizations optimize processes around AI capabilities. Projects that show negative ROI after 18+ months likely need course correction or cancellation.
Connect AI performance directly to business impact. Model accuracy means nothing unless you translate it to dollars. An 85% accurate model that prevents 500,000 in fraud beats a 95% accurate model that generates so many false positives you lose 800,000 in legitimate transactions.
Avoid the mistakes that kill ROI: poor data quality, no MLOps, overengineering, and lack of KPI ownership. Fix the data before building models, invest in deployment and monitoring infrastructure, start with simple solutions, and assign a single executive owner for business outcomes. These operational factors determine success more than the choice of algorithm.
Consider alternatives before committing to AI. Rule-based automation, process improvement, or additional headcount sometimes deliver better risk-adjusted returns than AI. Calculate ROI for all options and choose the one with the best value-investment-risk ratio.
Use incremental deployment and human-AI collaboration to maximize returns. Roll out to one area first, prove value, adjust, then scale. Combine AI automation with human judgment on complex cases. This approach reduces risk while accelerating time to positive ROI. Not Sure If AI Will Deliver ROI for Your Business? Schedule a free 30-minute ROI assessment call. We'll analyze your use case and show you realistic value projections before you invest a dollar.
How about to rate this article?
0 ratings • Avg 0 / 5 · Thanks for rating!
Written by:

CEO & Co-Founder
Slava Vaniukov is the CEO and Co-Founder of Softermii, with more than 10 years on the front lines of software development. He has spent that decade helping founders and enterprises turn ambitious ideas into products that ship — and that perform. Apps built by his teams have been featured on multiple “Top 10 Best App…


